


If you are updating your data visualisation dashboards and building an insightful data-verse for you and your team, you are in the right place.
Perhaps you have come across a massive list of Key Performance Metrics (KPIs) to track - too much information, or infoxication, that may blur your focus and, consequently, harm your performance. That’s why we would like to recommend a list of essential metrics that will help you understand what’s happening with your business performance and how to best leverage your data to make confident decisions when it comes to business growth.
Structure First
Sorting through metrics without a structure can throw a spanner in your data analysis. But fear not! Organising your data is like having a trusty guide on your growth journey – it's a tool for problem-solving and growth-hacking. It not only simplifies your data storytelling but also helps you sniff out opportunities along the way. Let's keep it structured and friendly using the Growth Marketing preferred tool: The Conversion Funnel.
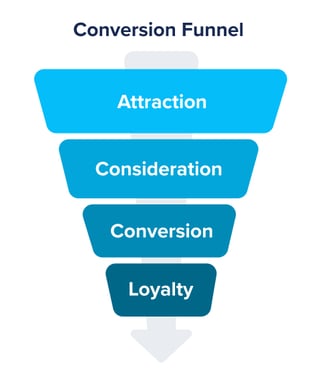
Attraction: This is the stage where you grab the spotlight. Attraction is all about drawing your audience into your digital territory such as a website or landing page with engaging content, eye-catching visuals, and a clear message.
Consideration: Now that you've piqued their interest, it's time to keep the conversation going. Consideration is the stage where you provide valuable information, showcase your offerings, and build a connection with your audience. It's all about what happens with them before they take any action with you.
Conversion: The moment of truth. Conversion is where you guide your audience towards taking a specific action, whether it's making a purchase, filling out a form, or signing up. This stage is all about turning potential into reality.
Loyalty or Retention: This stage is where you nurture the relationship with your customers, turning one-time buyers into repeat customers and brand advocates. This stage is all about sustainable growth and championing long-term business stability.
In the conversion funnel, each stage affects the next one, and when you track performance back through the funnel you can understand how one stage supports the next one (aka Conversion Rates). When you do this, you will get a clear idea of the magnitude of effort you need to implement to get the results you are aiming for.
Growth Marketing Metrics (List updated for 2024)
Attraction
Cost per Click (CPC): Cost of each click on an ad. There are different bidding methodologies within the different advertisement platforms. However, CPC is the most common and wider metric you can get. This is the financial side of the click game, each tap on your ad comes with a price tag. Budget optimisation starts by understanding if you are paying the right price for each click. Analyse if each click is bringing the right people and how much it costs you.
Cost per Mille (CPM): CPM, stands for cost per mille, with the Latin and old French word 'mille' meaning a thousand. Cost per thousand impressions or views. It’s about visibility. It shows if your brand is reaching a substantial audience and how much it costs to reach it. Understanding CPM helps you evaluate the overall cost-effectiveness of your ad campaign.
Click-Through Rate (CTR): Percentage of people who click on an ad after seeing it. Keeping an eye on CTR is like checking the audience's pulse – a higher rate means your ad has their attention, while a lower one suggests it might be time to rethink your strategy or you are targeting the wrong audience.
Return on Ad Spend (ROAS): Revenue generated for every dollar spent on advertising. This is about making wise spending choices. Analyse what channels are having better performance (money-wise) and if the ads are not just being displayed, but are also captivating or attracting the attention of your audience and drawing them towards your brand.
Domain Authority: Measure of a website's trustworthiness and relevance. You can get different rankings from different platforms based on their algorithms. This is a compound index that combines your website content, links that point to your website, the audience that visits you, the quality of actions they are doing on your website and the content you are using. Everything is about assessing your website’s relevance among your prospective customers and natural competitors and determining if its pages ‘deserve’ first positions on Google Search.
Consideration
Engaged Sessions: New** Heads up on this. Previously you were probably measuring ‘Page Views’. In 2023, Google Analytics changed the metric to Engaged Sessions, which is defined as: ‘the number of sessions that lasted longer than 10 seconds, or had a conversion event, or had 2 or more screen or page views’. It’s no longer about just hits on a page, it’s measuring active and real human users doing something on your page.
Users: Number of individuals who visit a website. New** From 2023, Google also changed the way it counts each session. Before Universal Analytics, Google counted every new hit as new. With the updated GA4, Google keeps continuity on the sessions, so you probably have had a decreasing number of users. But this doesn’t mean you have fewer people coming to your website, it’s because the platform adjusted itself to track individuals more accurately (although this is still not complete, one individual can interact with you from different devices, using different browsers and initiating different sessions, so it is not precise, but it’s closer).
Conversion Events: Actions users take that fulfil a predefined goal. These actions could be anything from making a purchase to signing up for a newsletter, indicating that they've journeyed from being visitors to actively engaged participants. They have interacted with your digital tools such as calculators, initiated a buying process or finalised it. Take into account that a conversion event should be only what is ‘valuable for your business’. For example, visiting a page could be just flagged as an ‘Event’, but downloading an eBook could be your ‘Conversion Event’.
Average Session Duration: Average time a user spends on a website. It is a definitive engagement metric that will let you know if the visitor is consuming your content or not. If you are wondering how long is considered a ‘session’, Google defines a default session ending after 30 minutes of user inactivity. There is no limit to how long a session can last. It starts when a user begins browsing your website or opens your app.
Goal Completion Rate: Percentage of users who complete a specified goal. The rate compares out of the total users who started a session how many of them successfully fulfilled a goal on your website. The higher the rate, the more successful interactions you're having.
Average Engagement Rate: New** Overall measure of user interaction. You probably have ‘Bounce Rate’ as part of your metrics. Google Analytics is however no longer reporting it. The updated metric is the ‘Average Engagement Rate’. An engaged session is a session that lasts longer than 10 seconds, has a conversion event, or has at least 2 page views or screen views. By the way, It’s the opposite of the old ‘Bounce Rate’.
Cost per Conversion (Cost/Conv.): Shows the average cost you have paid for each conversion triggered by your campaign. In other words, it’s the cost divided by the total conversions. If you are in Google Ads, you are probably tracking multiple conversion goals such as form submissions, calls, sign-ups, purchases, etc. In this case, you should differentiate each, as the cost per page view can’t be compared with the cost of a purchase.
Conversion Rate (Conv. Rate): Shows how often, on average, an ad interaction led to a conversion. It’s ‘Conversions’ divided by the interactions with your ad. This is a metric that shows in a simple way if your communication is activating the actions you are pursuing with your campaign.
Conversion
Subscribers: Potential customers expressing interest in your brand’s content. It is a contact that has opted in to hear more from you by signing up for your blog or newsletter.
Leads: A contact or company that has converted on your website or through some other interaction with your organisation beyond a subscription sign-up. For example, they have downloaded an eBook or filled in a form to access a lead magnet asset.
Marketing Qualified Leads (MQLs): Leads showing potential for marketing efforts. These leads have been qualified by your marketing team and are a fit with your target audience profiles. For example, they are in the right industry or belong to a company size that fulfils your requirements.
Sales Qualified Leads (SQLs): Leads deemed ready for sales. This is an evident potential customer, which is ready for the sales team.
Opportunities: Potential deals in the sales pipeline. In CRM platforms, like HubSpot, this is for those customers that are associated with a potential deal.
Won Customers: Successfully converted and paying customers.
Cost per Acquisition (CPA) or Cost per Lead (CPL): Cost of acquiring a customer or lead. You can break down the cost per each lead lifecycle stage, campaign, or across your whole business to mark down how much it costs for your company to acquire an effective customer.
Lead Conversion Rate: Percentage of leads converted to customers. This is the comparison between one stage to the next one. Shows how many leads you are losing on the conversion pathway and where possible leaks could be fixed.
Loyalty or Retention and Growth Cycle:
Return on Investment (ROI): Measure of profitability from an investment is the profitability yardstick for your investments. It's not just about spending money; It's about measuring the success of that spending.
Customer Lifecycle Value (CLV or CLTV): Predicted revenue from a customer throughout their relationship with your organisation. This is the potential value of each of the leads you are converting into your funnel. It predicts the total revenue you can expect from a customer throughout the entire journey with your brand.
Email Click-Through Rate (CTR): New** Well, indeed, the percentage of email recipients who click on links is not a new metric. What is new is that we are losing the possibility of getting the ‘Email Open Rate’ due to privacy changes on the different platforms. So, as we can’t really ‘see’ how many of our emails are being opened, we are moving forward to track the clicks that email is triggering. Keep in mind sending emails with cool and appealing Call to Action (CTA) buttons to be able to track them down.
Churn Rate: Percentage of customers who stop using a product or service over a given period. The exit sign in your customer base. It's the percentage of customers who bid farewell and stop using your product or service within a specified period. Tracking the Churn rate along with CLV makes your life easy when forecasting results.
Customer Satisfaction (CSAT): Measure of how satisfied customers are with a product or service. This ‘happiness meter’ is custom-made for your business. It defines what makes a client satisfied and how you can track it down.
Repeat Purchase Rate: Percentage of customers who make more than one purchase. One of the growth marketing goals is making the current customers invest more in your company either by increasing the ticket value or cross-selling. CRM platforms such as HubSpot make it easier to track.
Accurate predictions and confident decision-making arise when the metrics shaping your data are clear, consistent, and straightforward. We recommend pinpointing the genuine data that defines your unique success – a targeted approach that unveils the core of your business's performance.
In a world saturated with information, where 'infoxication' is a real concern, clarity becomes a must. Our ultimate advice: declutter your dashboards, rid them of any information that doesn't contribute to building your end goal, and set clear objectives.
While data visualisation presents challenges, it's entirely achievable. Let predictive models fuelled by AI and purpose-built platforms such as HubSpot be your allies in simplifying the decision-making process. Embrace the possibility of transformation through strategic data visualisation and witness the true power it can unleash in shaping the trajectory of your business.
Contact us to learn how Fileroom can help you build your HubSpot data-verse.


.png)